By Dr. Klaus L.E. Kaiser ——Bio and Archives--April 14, 2012
Global Warming-Energy-Environment | CFP Comments | Reader Friendly | Subscribe | Email Us
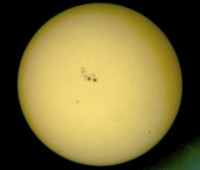
 ...the sunspots that is. You might ask why?
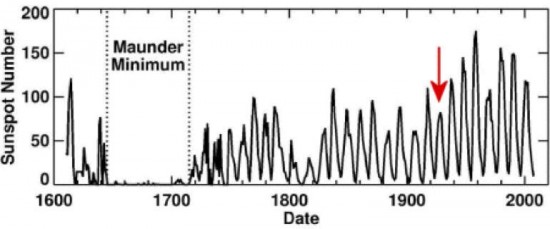
The number of sunspots on the sun is changing all the time. That number is highly linked to changes in the earth’s climate. The more sunspots there are the more radiation comes to earth. In turn, more radiation means more energy received and warmer climate on earth.
 Of particular interest is the Maunder Minimum during the second half of the 17th and the early 18th century. It was period of extraordinary cold winters in Europe and North America called the “Little Ice Age.” The painter Jan Grif(f)ier (the elder, ca. 1652–1718) recorded the situation in his work The Great Frost in 1683. Many people succumbed to the severe temperatures and concurrent lack of food from the shortened lengths of the growing seasons.
 When looking at the longer term variations of the peaks of sunspot cycles, one may wonder when the next strong (longer-term) downturn may come about. Some ominous signs are on the horizon: According to predictions by NASA scientists, the current cycle will reach its peak later this year or in 2013, but at a lower maximum than in the previous cycles, more or less reminiscent of the peak in 1928 (indicated by the red arrow) is anticipated to follow thereafter. The next minimum number of spots will then occur around 2019 and, after that, all bets are off.
Current longer term predictions by NASA are for low activity over several decades to come. If that comes true, another mini-ice-age could be in the offing as well.
Watch the spots and keep warm!
When looking at the longer term variations of the peaks of sunspot cycles, one may wonder when the next strong (longer-term) downturn may come about. Some ominous signs are on the horizon: According to predictions by NASA scientists, the current cycle will reach its peak later this year or in 2013, but at a lower maximum than in the previous cycles, more or less reminiscent of the peak in 1928 (indicated by the red arrow) is anticipated to follow thereafter. The next minimum number of spots will then occur around 2019 and, after that, all bets are off.
Current longer term predictions by NASA are for low activity over several decades to come. If that comes true, another mini-ice-age could be in the offing as well.
Watch the spots and keep warm!View Comments
Dr. Klaus L.E. Kaiser is author of CONVENIENT MYTHS, the green revolution – perceptions, politics, and facts Convenient Myths